Faster Decisions. Smarter Wells. Better Performance.
Liken is Intellicess’s unified drilling intelligence platform, custom-built for operators and powered by Sentinel RT® engine and advanced physics-based models licensed from the University of Texas at Austin. It closes the gap between the data operators already collect, siloed physics-based simulation packages, and the understanding they need to make faster, smarter decisions in time to matter.
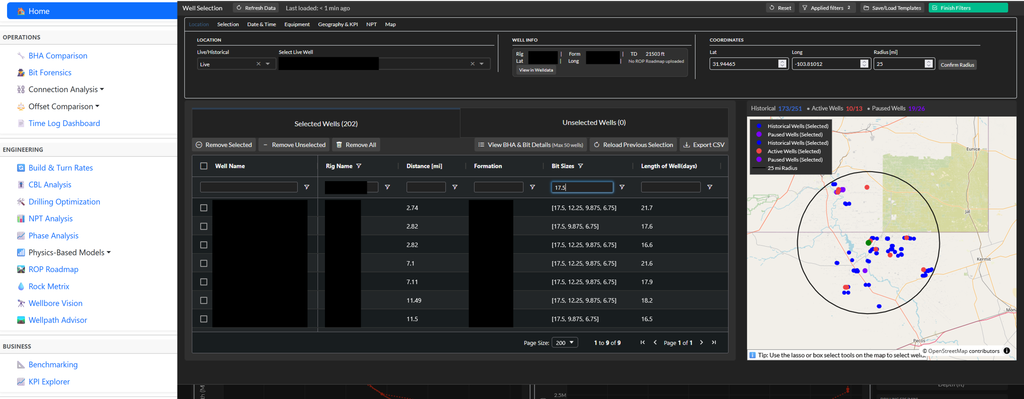
Today, that gap comes from four recurring problems. Engineers lose hours to manual analysis, wrangling data across disconnected systems before they can even begin to study offset wells and run simulations using physics-based models. Real-time rig data, daily reports, geology and supplier reports live in separate tools with no unified view, creating blind spots that hide invisible lost time (ILT). By the time an analysis is finished, the rig has often moved on to the next well or pad, so nonproductive time (NPT) and suboptimal parameters persist uncorrected. And custom engineering spreadsheets, built one well at a time, can’t be shared, versioned or applied consistently across an operation.

What Liken Delivers
Liken addresses each of these problems directly, bringing well design, fleet-wide performance tracking and unlimited customization into a single web platform built on top of your existing data sources. The use cases below walk through the specific ways Liken is deployed in the field today.
Drilling Analytics That Deliver Value
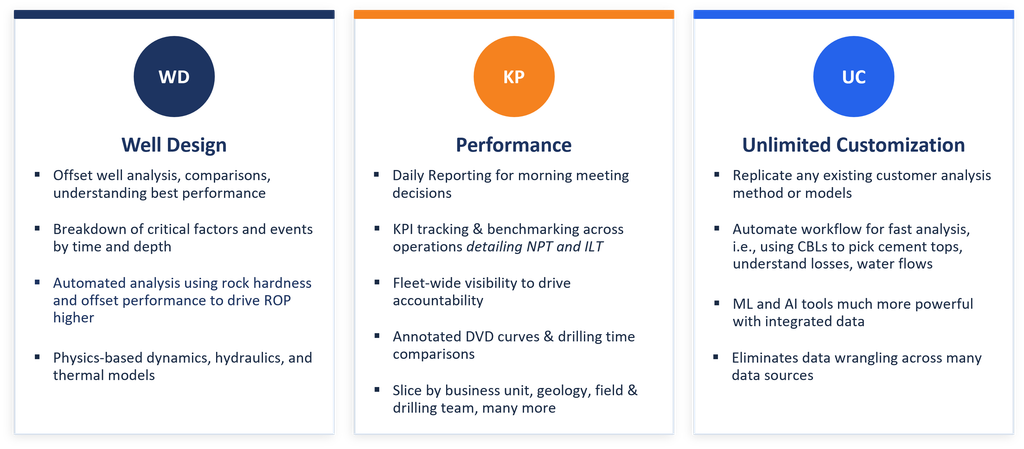
Liken delivers drilling analytics that translate directly into measurable value. Engineering teams save more than 10% of their time by eliminating the wasted effort of pulling data together manually, finding information faster across multiple sources, and turning offset analysis and well planning from an hours-long task into a matter of minutes. A fleet-wide dashboard keeps teams and managers aligned, sharpens morning meetings by focusing on variation, and uses standardized KPIs to drive accountability and performance. With data readily available and Sentinel RT outputs powering deeper analysis, engineers can spend their time where it matters most, leading to better decisions across the board. The result is an expected 10% reduction in drilling costs, roughly $4,000 a month saved on server and IT support, and a service that pays for itself with just one rig day per year.

Case 01: Daily Reports & Fleetwide Comparisons
Staying current across multiple wells with data scattered across different tools is one of the most time-consuming parts of an engineer’s day. Concise, live reporting that pulls from every source at once removes that burden and lets operations teams make decisions with same-day information rather than yesterday’s.
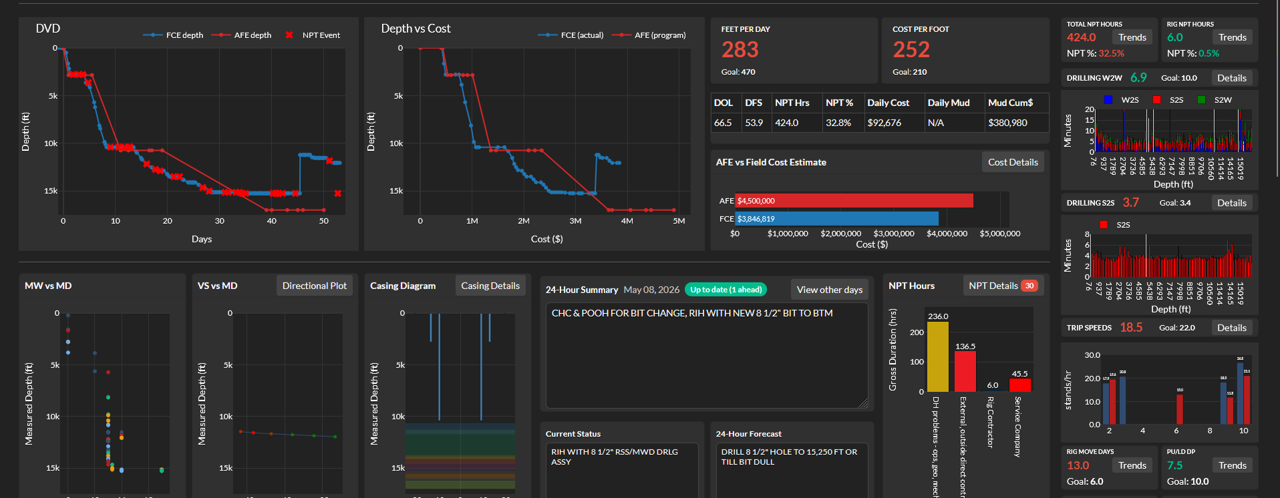
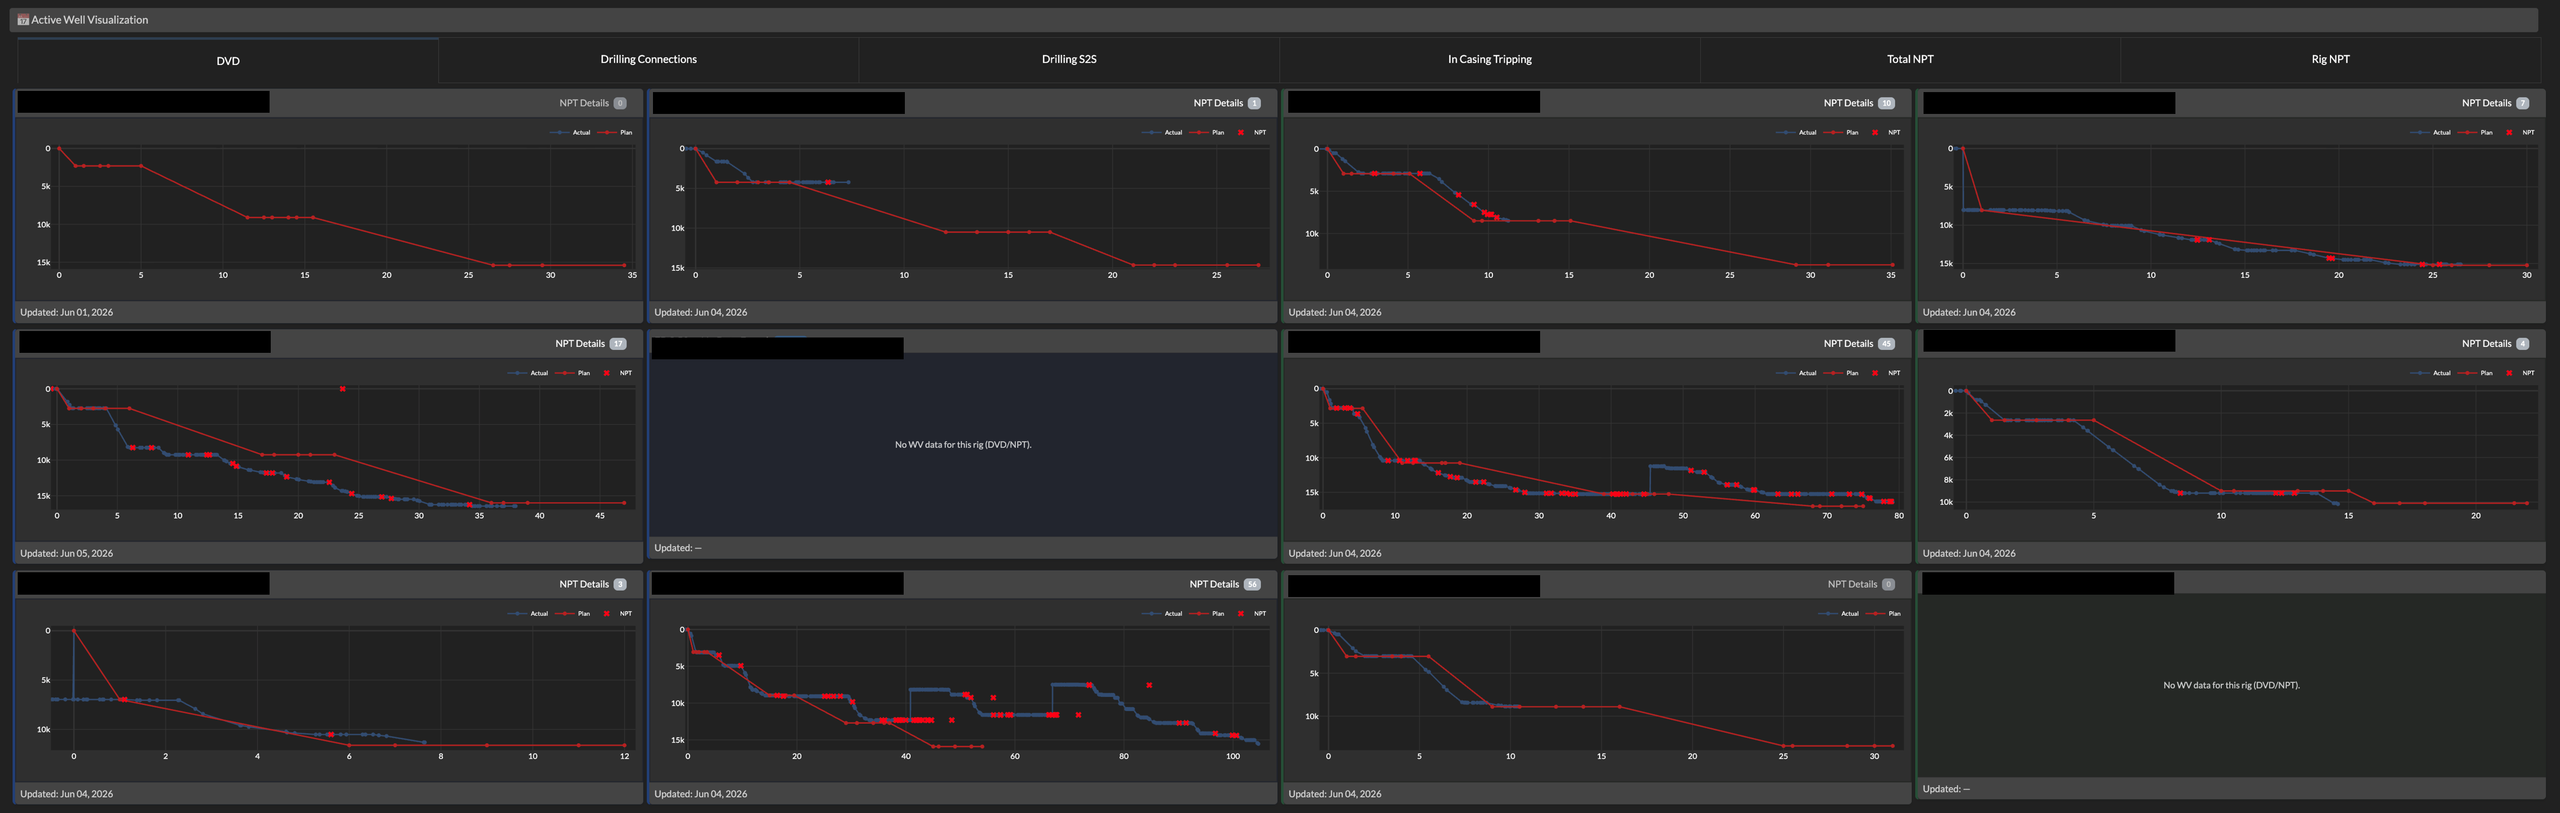
Liken’s Daily Report gives operations a quick, standardized summary immediately, with live wells organized across multiple tabs so nothing is missed at the start of a shift or a morning meeting. Alongside it, the Fleetwide Comparison view lets teams benchmark performance against offsets in the ways that matter most to them, including by formation top, hole section and supplier, so a rig’s performance is always read in context rather than in isolation.
Because both views draw from the same underlying data integration layer, there is no manual compiling or reconciling required. Engineers spend their time interpreting results instead of assembling them, and managers get a fleet-wide view that keeps every team, from the rig site to the head office, working from the same numbers.
Case 02: Offset & BHA Analysis
Designing a better well starts with using every bit of history available, including the AI-generated outputs already produced by Sentinel RT®. When that history is hard to pull together, engineers fall back on gut feel and best guesses instead of what the offsets actually show.
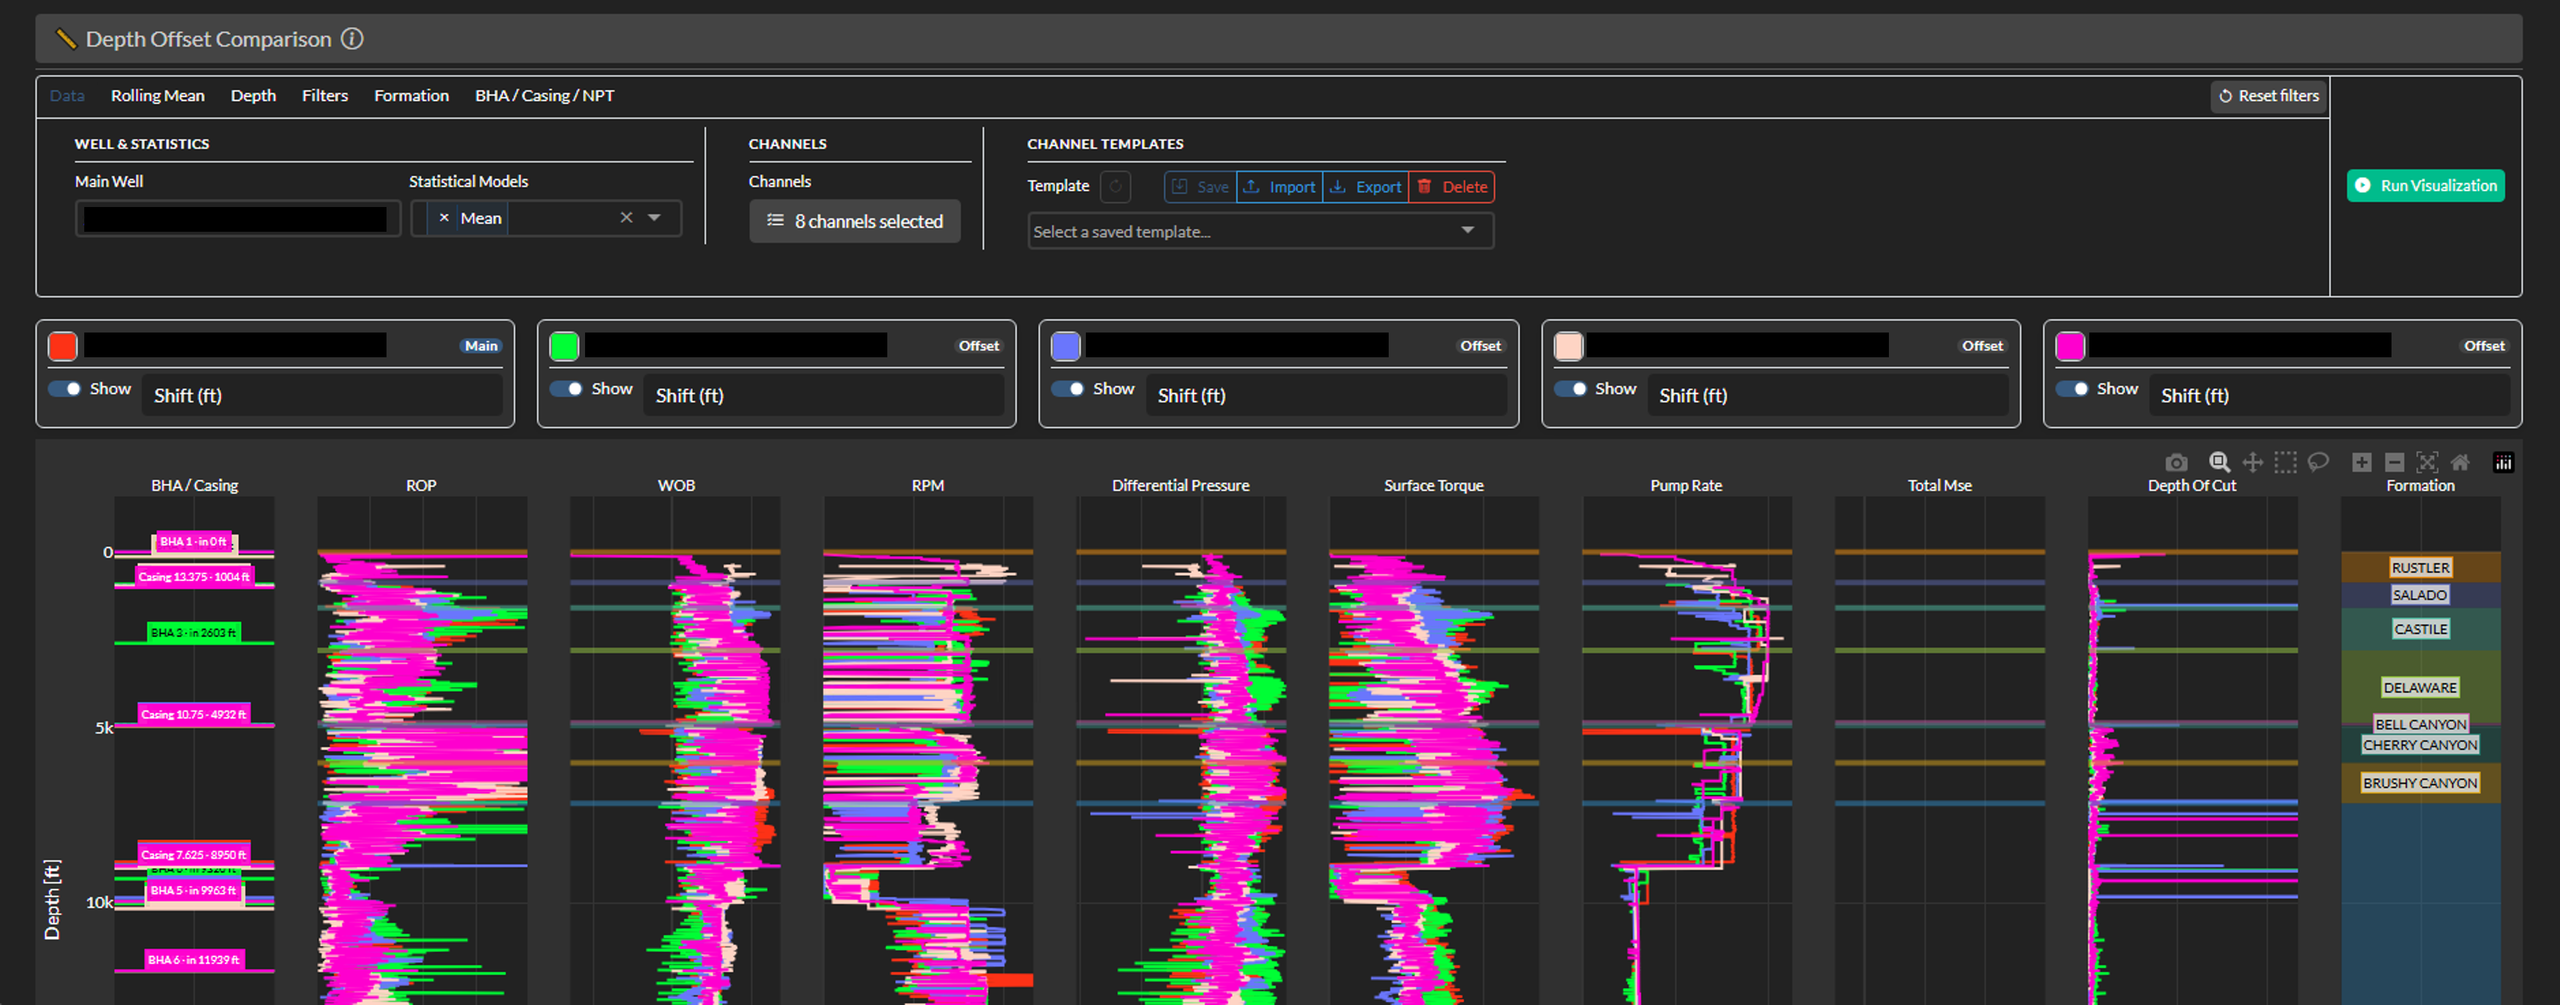
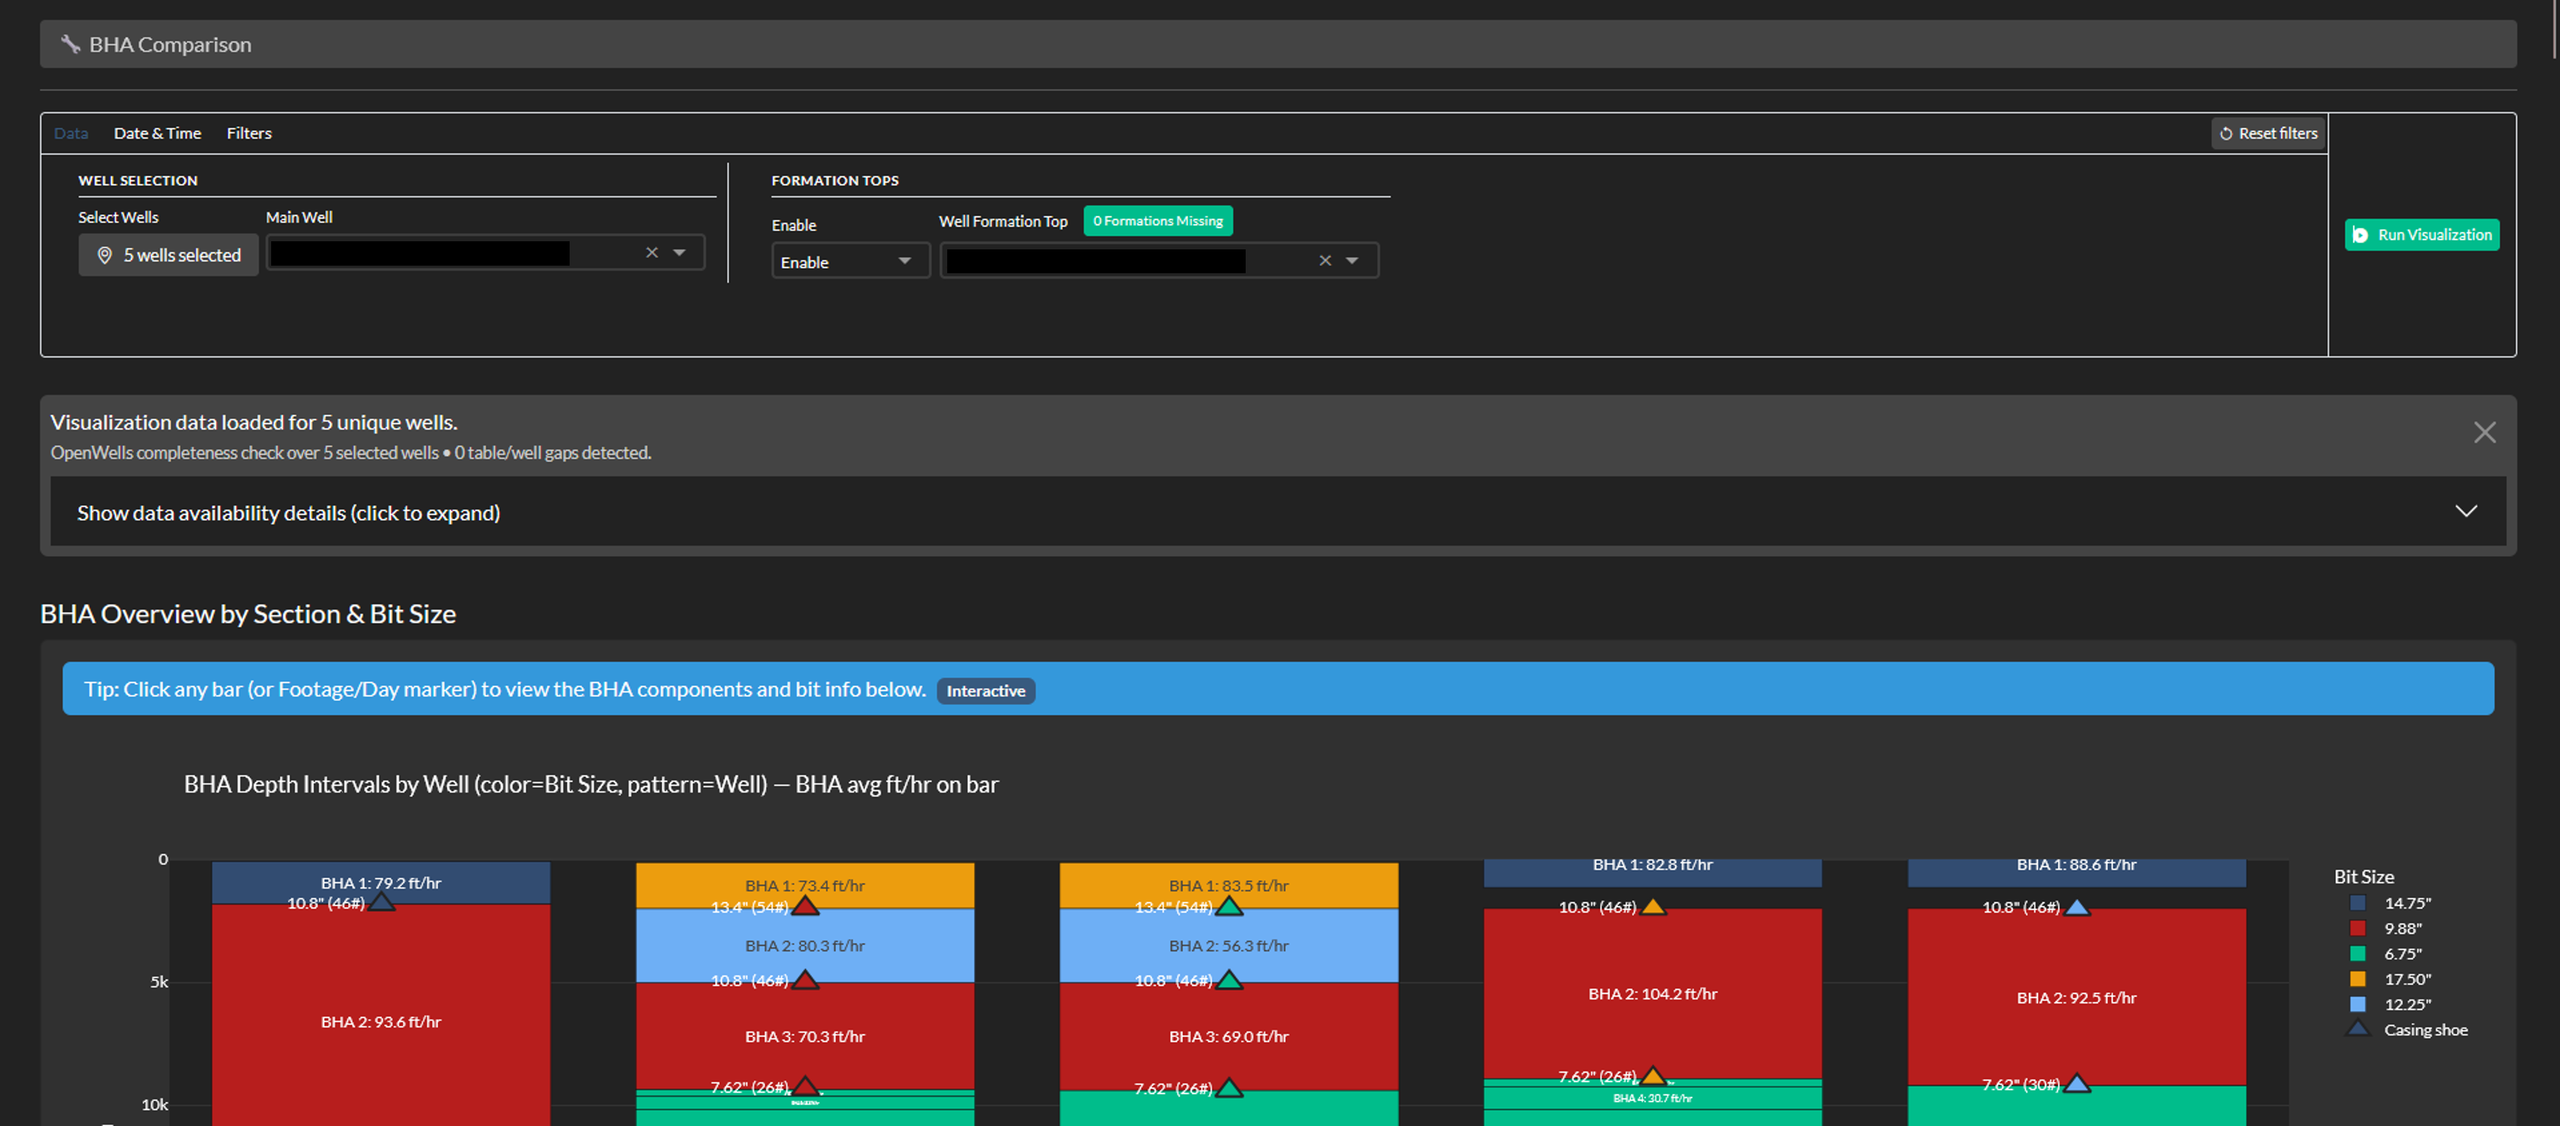
Liken’s BHA Comparison and Offset Comparison tools bring that history into one place. Engineers can compare BHA performance against offsets by formation top, hole section or supplier, and plot offset data by time or depth alongside NPT, casing, BHA and formation information. Bit forensics combine supplier photographs with dysfunction data pulled directly from Sentinel RT®, so wear patterns and drilling behavior are reviewed side by side.
Build and turn rate analysis is merged with rotate/slide and formation data to explain directional performance, and physics-based torque and drag (T&D), surge/swab, and critical RPM models, calibrated to field data, give planners a grounded basis for the next well’s design rather than a theoretical one.
Case 03: KPI Explorer & Benchmarking
Every level of an organization, from a single well engineer to a fleet manager, needs its own view of performance, but building and maintaining custom analytics for each of them by hand doesn’t scale. A standardized, self-service way to explore KPIs is what makes consistent benchmarking possible.

The KPI Explorer gives engineers custom, sharable templates that group data by pad, rig, formation and more, with multi-view linking driven by a single master plot. It tracks more than 40 parameters, including whirl, loss detection, ECD, torque and gain/loss, and exposes ILT and NPT using both real-time and daily report data, so nothing is missed just because it only appeared in one source.
Benchmarking layers in annotated DVD curves and drilling-time comparisons against P50/P90 and best-in-class estimates, with wells grouped and normalized by pad, rig, formation or hole size in seconds rather than hours. Because templates are sharable across the team, one engineer’s analysis method becomes the whole team’s standard, not a one-off spreadsheet that lives on a single laptop.
Case 04: Connection Analytics & Time Log
Invisible lost time hides in routine operations like connections, which are individually small but add up to a significant share of total drilling time across a fleet. Spotting which rigs, phases or crews are running slower than the rest requires a fast, fleet-wide view, not a well-by-well review.
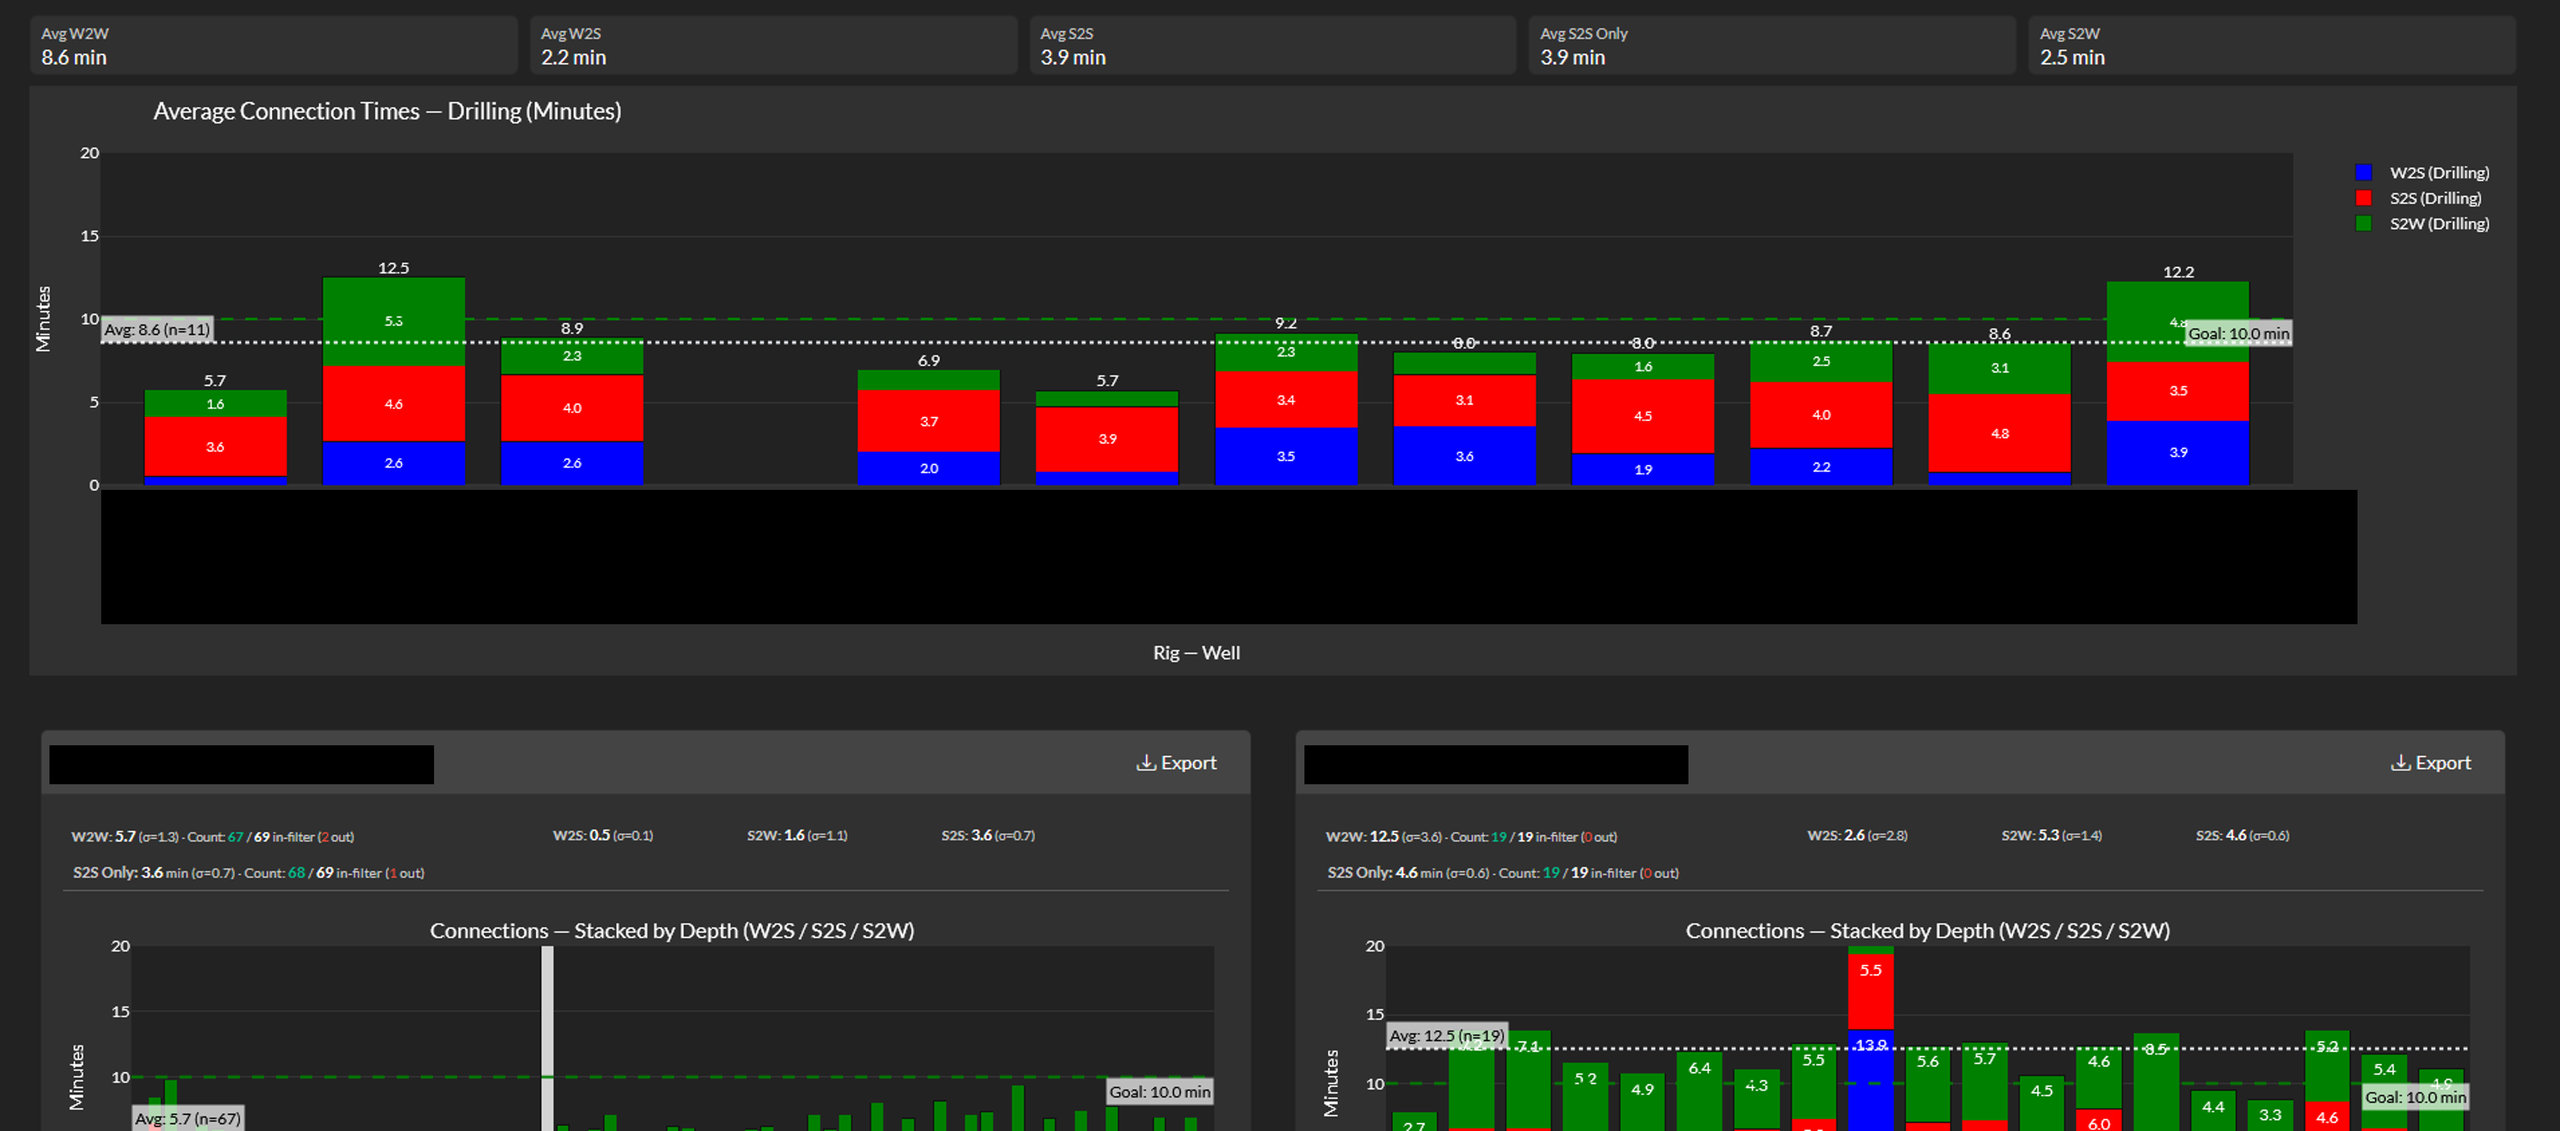

The Time Log Dashboard gives a visual breakdown of time by rig, phase and NPT category, with trends tracked across wells so a slipping pattern is visible before it becomes a habit. Connection Analysis compares connection speeds across the entire rig fleet, with admin-level data-cleaning tools to keep comparisons fair when data quality varies between rigs.
NPT and ILT are both exposed in quick, filterable views, phase-time comparisons use standard DDR definitions so results are comparable across contractors, and a custom plot builder with interactive mouse-over drill-down lets engineers go from a fleet-wide trend down to the specific connection that caused it in a few clicks.
Case 05: ROP Roadmap Generation
Determining the optimal drilling parameters for a new well traditionally takes an experienced engineer days of manual offset analysis. A faster path from offset data to field-ready parameters shortens that cycle from days to minutes.
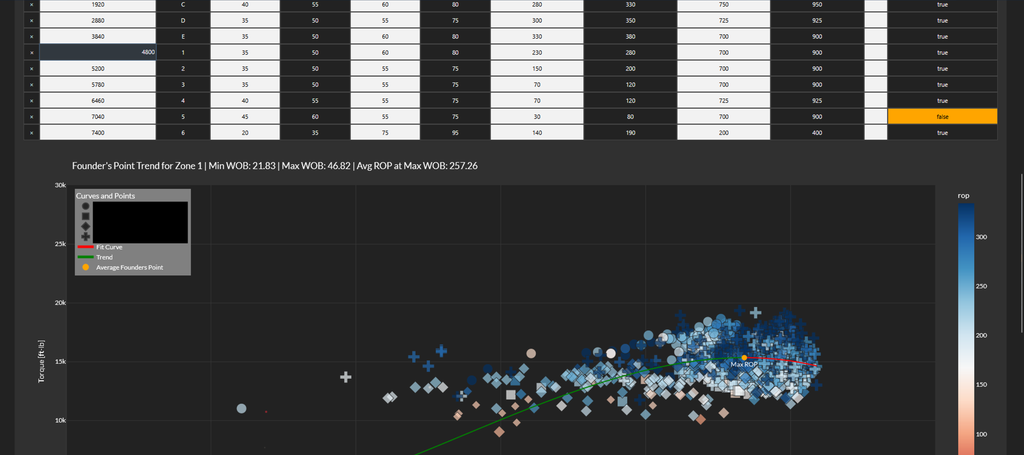


Liken’s ROP Roadmap is built in three steps. First, a synthetic rock strength (UCS) model is generated from sonic offset data. Second, Founder’s Curves are derived for each formation from offset performance, identifying the point at which additional weight on bit stops improving rate of penetration. Third, adherence to the resulting roadmap is tracked in real time and fed back into the next well’s plan.
Roadmaps that once took days are generated in minutes, with fully customizable settings, and the workflow is integrated with Sentinel’s cone drilling modules end to end. Where NOV RigSense™ is in place, the resulting parameters can be uploaded to the rig directly, with adherence monitored automatically once drilling begins.
Case 06: Understanding Directional Tendencies
When build and turn rates drift from plan, the cause is often visible in offset data, but only if survey, formation, Sentinel RT outputs and daily report information are viewed together. Without that combined view, directional issues tend to get explained after the fact rather than anticipated.


Liken’s Wellpath Understanding view brings survey data together with Sentinel RT outputs and daily report information so directional trends can be studied in context rather than in isolation. Build and turn rate analysis shows exactly where issues arise relative to formation changes, and tracks tortuosity, slide effectiveness and toolface efficiency alongside them.
Engineers can see quickly whether a directional problem on the current well is a new issue or a recurring pattern already visible in the offsets, and adjust the plan accordingly instead of discovering the same issue again on the next well.
Case 07: Custom Geomechanics & Cement Evaluation Workflows
Every operator has its own way of analyzing geomechanics or evaluating cement jobs, refined over years and often locked inside one engineer’s personal spreadsheet. Replicating that method reliably, and running it in minutes instead of hours, requires automating the workflow itself, not just the data behind it.
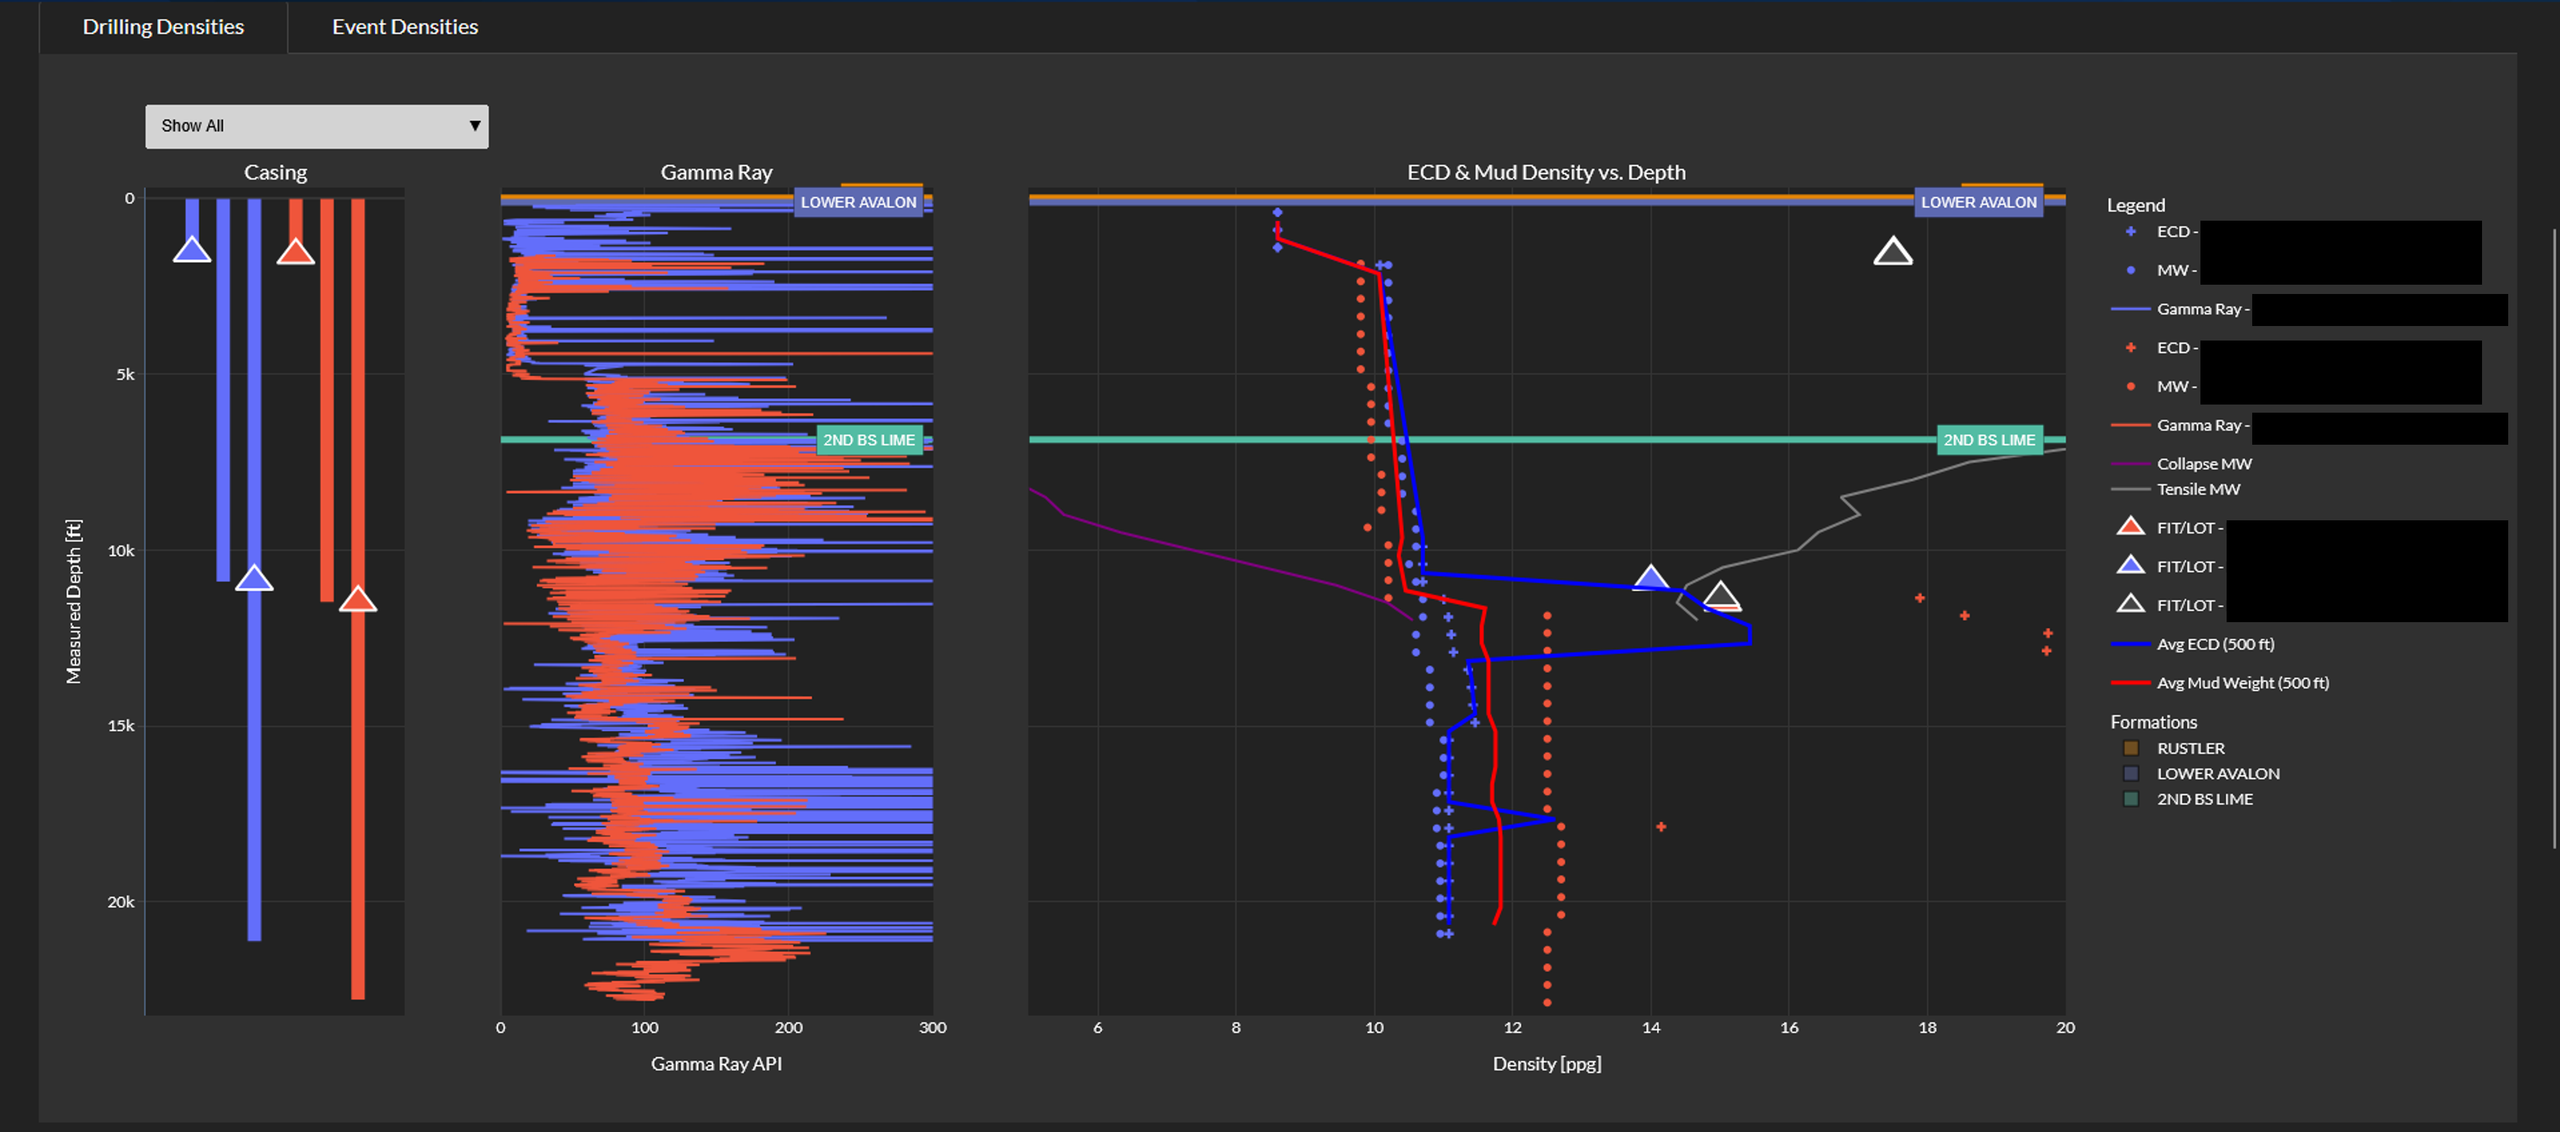
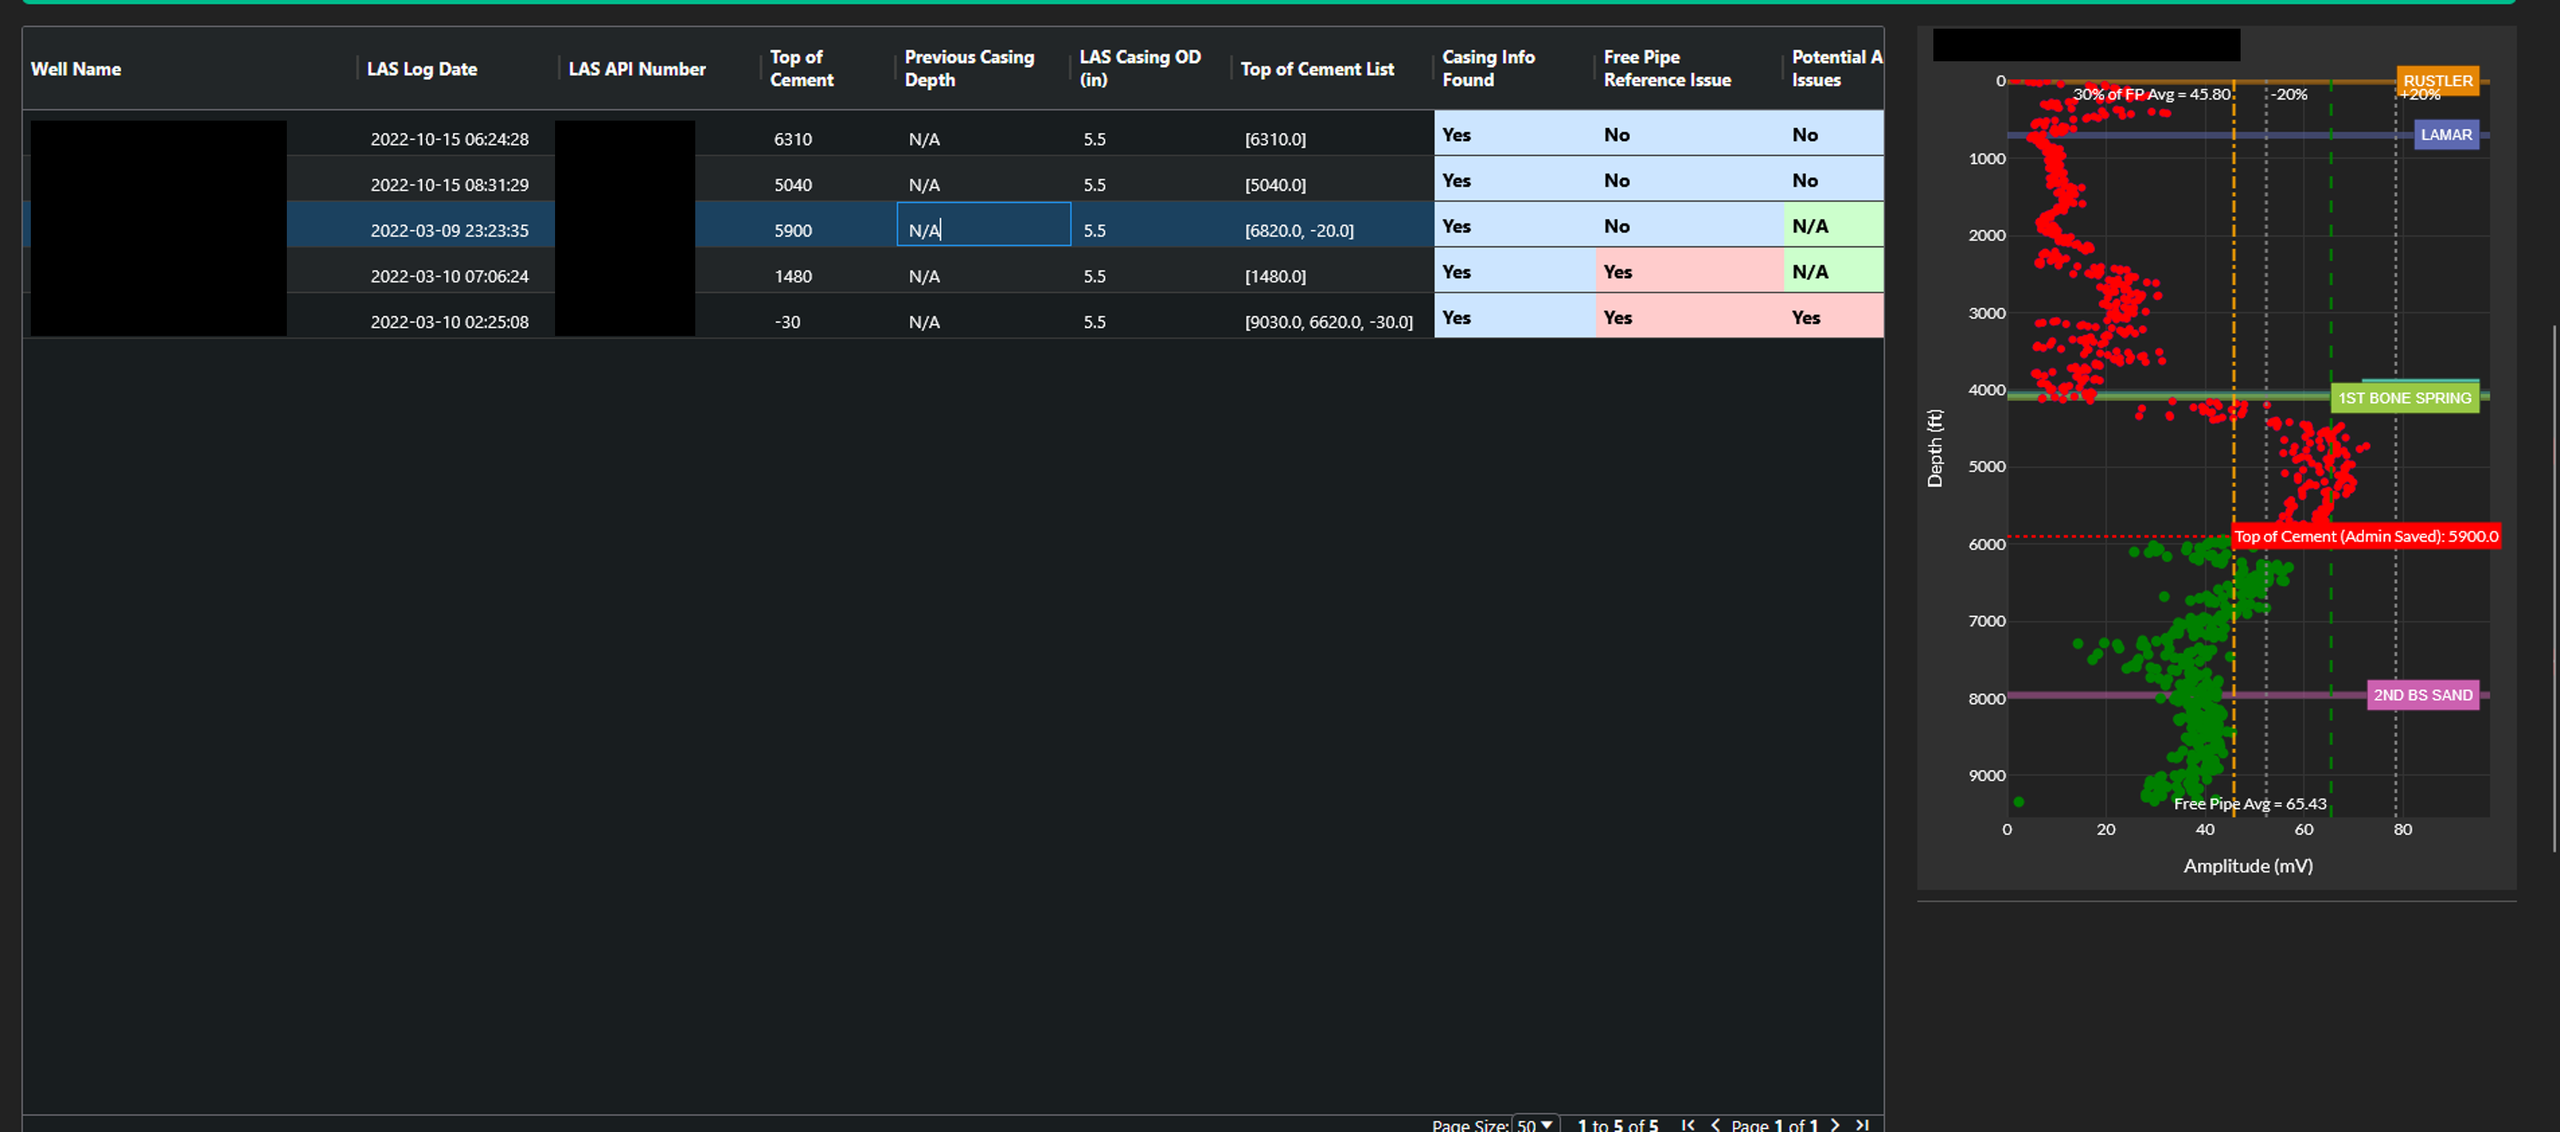
Liken’s Understanding Geomechanics workflow automatically pulls together gamma ray, pore pressure/fracture gradient (PP/FG), FIT/LOT, mud weights, ECD/ESD, water flows, losses and kicks, drawing on Sentinel RT outputs, into one automated analysis. Picking Cement Tops applies the same principle to cement bond logs, automating an analysis that typically takes hours down to minutes.
Because Liken can replicate any existing customer analysis method or model, teams aren’t asked to abandon workflows that already work. Once built, that automated workflow eliminates the data wrangling across sources that used to precede it, and gives the operator’s own ML and AI tools more powerful, better-integrated data to work with.
Case 08: Integrated Physics Based Models
Engineers no longer run physics-based simulation packages the way they used to, opening a separate tool and building an input file by hand. The expectation now is that well and rig data feed the simulation engines automatically, so a calibrated result is ready before an engineer ever opens the model.


Liken’s Well Hydraulics model breaks standpipe pressure down by annulus, bit, tools and pipe at any flow rate, with mud rheology and motor or agitator pressure-loss curves calibrated to the specific string and mud in use, so an engineer can see exactly where pressure is being spent before committing to a program.
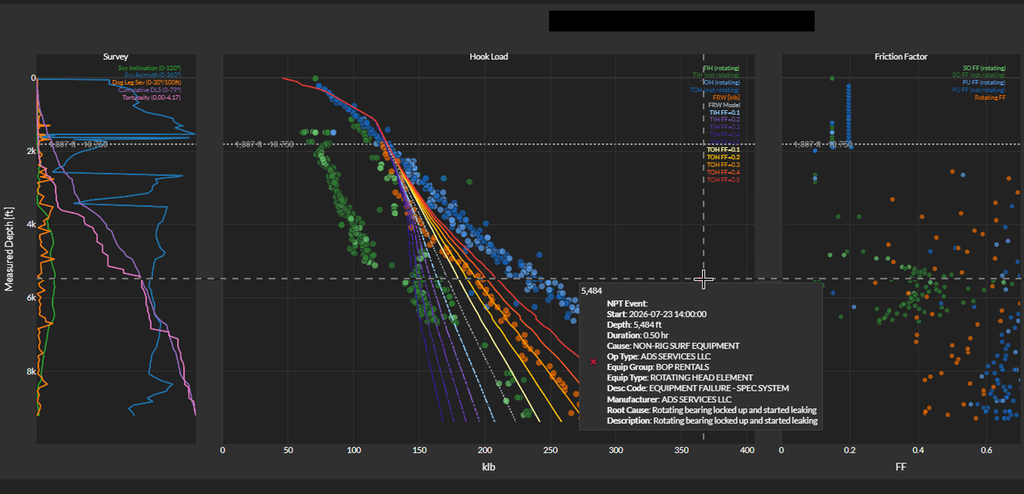
Drillstring dynamics are covered end to end. Torque and drag profiles track dogleg severity, azimuth, and tortuosity, an interactive rocking simulator predicts the pipe rocking RPM and wraps needed to reduce friction along the drillstring depth, and a BHA lateral FEM model determines the string’s natural mode shapes to flag critical RPMs before they get drilled through. The Critical RPM Comparison view checks that work against reality, overlaying model curves by friction factor directly on live field RPM and MSE data.
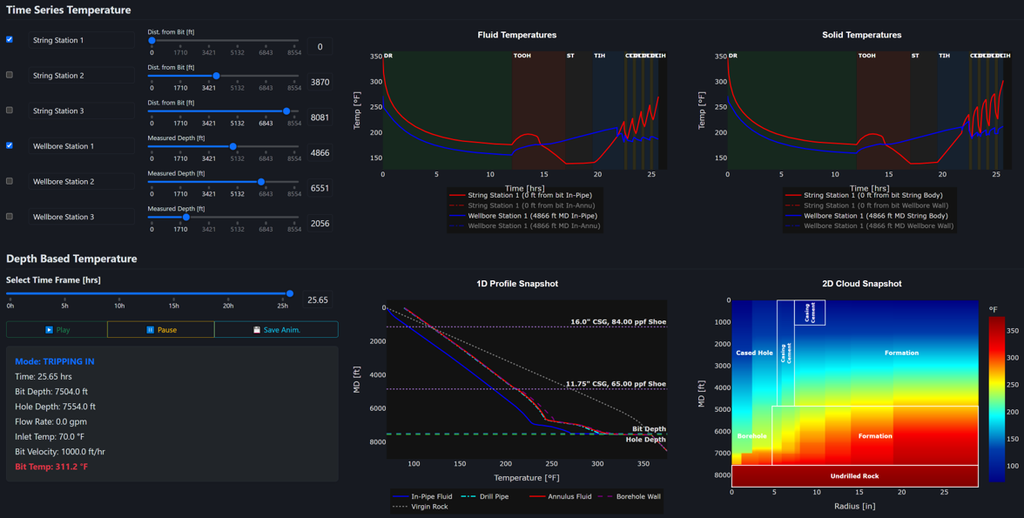
Thermal models round out the suite, tracking fluid temperature over time at multiple locations along the wellbore, with 1D depth profiles and 2D radial snapshots showing how heat moves from the formation through the wellbore and into the drill string as an operation progresses.
Why Liken ?

How Liken Works?
Deployed in 30-60 days. Grows with your operations.
Data Integration. Connects to well construction databases (WellView, OpenWells®), real-time rig data, Sentinel RT (DBA) AI, log data, and more, through automated pipelines running at frequent intervals, no manual data wrangling.
Web Platform. A web platform built on top of those data integrations, using well construction databases, real-time rig data, and Sentinel RT (DBA) outputs, designed for constant innovation without burdening IT resources.
Flexible Deployment. Deployed on operator private cloud or NOV Max platform, shared with WellData 4.0 for remote monitoring, with a flexible cost model — just one rig day per year covers all service cost for that rig.
- 30-60 day deployment
- Any cloud or on-prem
- Infinite customization
Ready to Transform Your Drilling Operations?
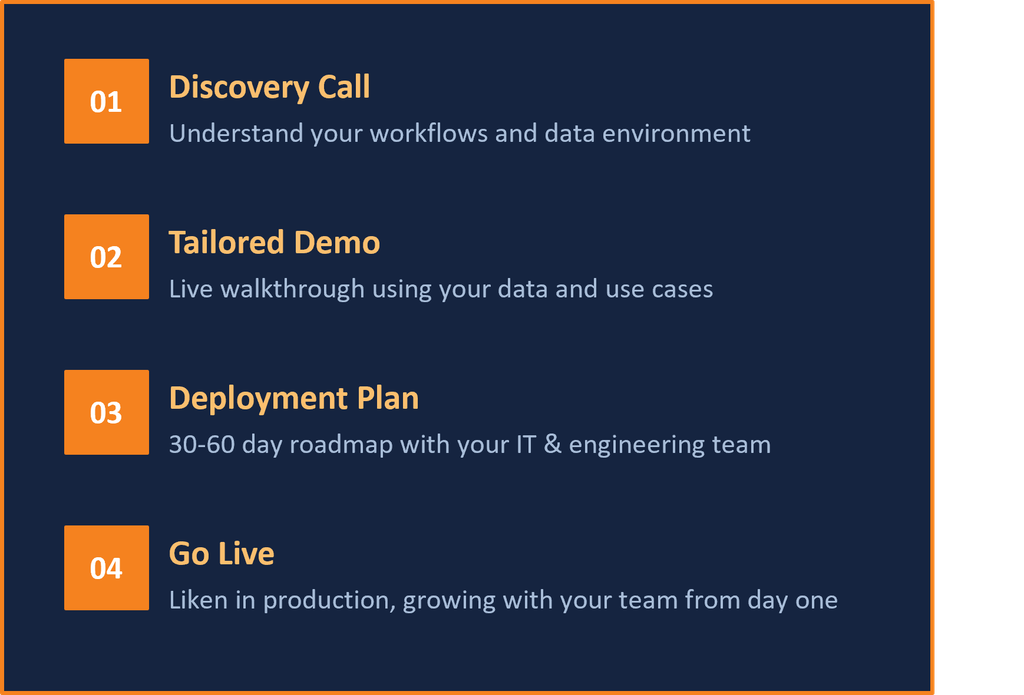
Get started today:
- Request a live demo
- 30-60 day deployment
- Flexible SaaS, day-rate pricing, or both